
What You Get – Out of the Box
A set of ready-to-use, actionable, interactive CFO Dashboards and Reports, deployed into your Power BI tenant.
Fully automated - scheduled refresh from NetSuite.
One version of the truth.
Ready on day one.
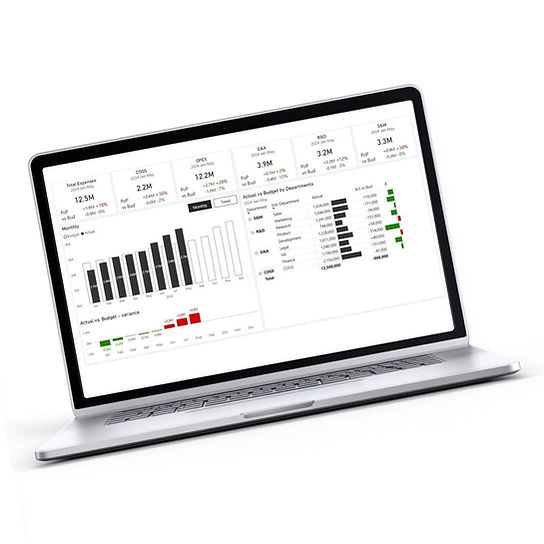
Budget vs Actual
by account, department, location and subsidiary
See budget overruns while there is still time to act – by accounts, departments, locations and subsidiaries.
Clear ownership at the department level turns visibility into accountability.

Profit & Loss Analytics
by period, department, subsidiary, accounts
One consistent, trusted P&L view for management and the board.
Automatic consolidation across all subsidiaries.

Expense Analytics
by period, department, account and vendors
Maintain full control over COGS, OPEX, and CAPEX.
Track spend by department, account, and vendor, with easy drill-down to transaction level - vendor bills, accruals, and journal entries.

Balance Sheet Analytics
by period, subsidiary and accounts
Easily analyze assets, liabilities, and equity with clarity.
Board-ready balance sheet views.

AP & AR Aging
by customer, vendor, invoice
Identify overdue receivables immediately.
Control payables and vendor exposure.

From data to insights - fast
1
Intro Call (20 minutes)
We walk you through a live demo, ask a few focused questions, and confirm your NetSuite setup is ready for FI Analytics.
2
Same-Day Deployment
Once you decide to move forward, we securely connect to NetSuite and deploy your out-of-the-box Power BI dashboards - the same day.
3
Fine-Tuning & Go-Live
We finalize delivery and schedule data refreshes, so your team can start using the dashboards immediately.

FAQ
Who is FI Analytics designed for?
FI Analytics is built for CFOs, finance directors, FP&A teams, and finance managers in fast-growing companies, typically with 50 to 600 employees, that need better financial visibility without a heavy BI project.
How fast can FI Analytics be deployed?
In many cases, standard dashboards can be delivered the same day. We connect securely to NetSuite and start delivering value immediately.
Do we need an internal BI team to use FI Analytics?
No. Dashboards are deployed into your Power BI environment, refresh automatically, and are easy to use. No dedicated BI resources are required on your side.
What systems does FI Analytics connect to?
FI Analytics connects directly to NetSuite. In some cases, Budgets or other additional data can come from Excel, Google Sheets, Sharepoint. Additional systems such as CRM or HR platforms can be added if needed.
Can department managers see only their own data?
Yes. Role-level security allows each user to see only the data relevant to their role. CFOs and finance teams retain full visibility.
Can we customize dashboards and metrics?
Yes. FI Analytics comes with out-of-the-box ready-to-use dashboards but is fully customizable. Dashboards, calculations, and structures can be adapted to your chart of accounts, entities, departments, and reporting needs.
Do your dashboards follow IBCS data visualization standards?
Yes. FI Analytics applies IBCS (International Business Communication Standards) best practices for financial and management reporting. This ensures consistent use of layouts, colors, terminology, and variances, so management and the board can read reports faster, avoid misinterpretation, and focus on decisions rather than formatting.
Can we use Excel or Google Sheets for budgets?
Yes. Many customers manage budgets outside the ERP. FI Analytics combines NetSuite actuals with Excel or Google Sheets budgets without changing existing processes.
What other dashboards and metrics can be added to FI Analytics?
FI Analytics can be extended far beyond standard financial reporting.
We have years of experience building business dashboards on top of systems such as NetSuite, Salesforce, HubSpot, HiBob, BambooHR, Comeet (Spark Hire), SAP Business One, and others.
Common additions include SaaS metrics (ARR, GRR, churn), sales funnel and sales performance dashboards, cash flow analytics, customer collections, inventory analytics, customer service metrics, quote-to-cash reporting, HR and headcount metrics, and recruitment performance dashboards.
Do we need to rebuild the model to add new systems or metrics later?
No. FI Analytics is built on a flexible semantic model designed for expansion.
New systems, dashboards, and KPIs can be added incrementally without rebuilding existing reports or disrupting current users.
Add-ons for FI Analytics


Intelligent Business
Tel: + 972 504 471881
E-mail: info@ibusinessbi.com
Address: Ha-Gavish St 4, Netania, Israel